|
|
|
|
Population Information |
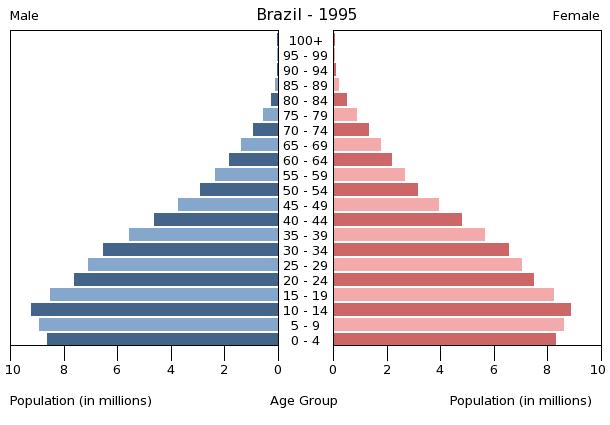
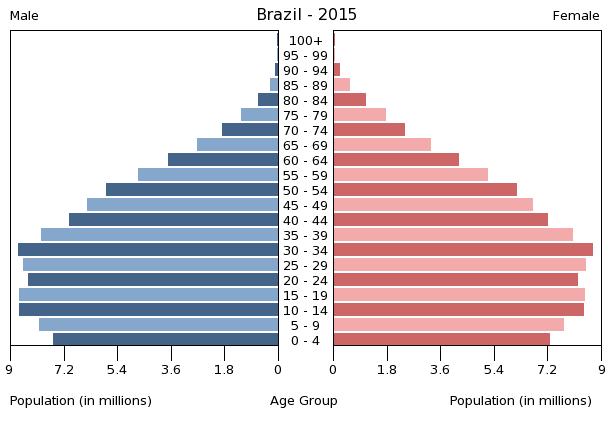
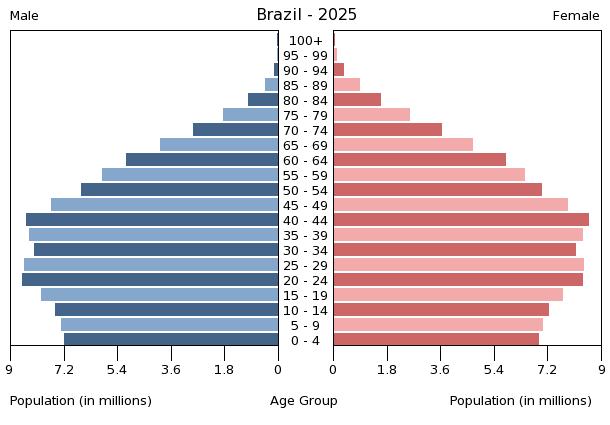
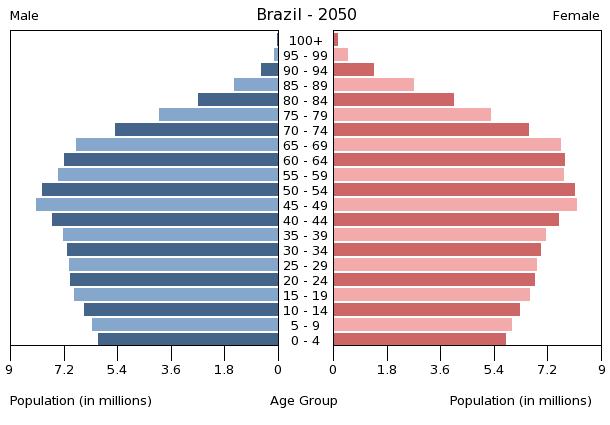
Demographic Transition Model Paragraph |
|
Population - 205,823,665 people
Arithmetic Density - 24.6 people/sq km Physiological Density - 74.9 people/sq km arable land Agricultural Density - 11.8 farmers/sq km arable land CBR - 14.3 births/1,000 population CDR - 6.6 deaths/1,000 population NRI - 7.7 people/1000 population Net Migration Rate - Negative 0.14 migrants/1,000 people Population Growth Rate - 0.75% IMR - 18 deaths/1,000 live births TFR - 1.76 children born/woman Population Age Under 15 Percentage - 22.79% Population Ages 65 and Over Percentage - 8.06% Dependency Rate - 30.85% Life Expectancy at Birth - 73.8 years Life Expectancy at Birth Females - 77.5 years Life Expectancy at Brith Males - 70.2 years HIV/AIDS Among People Ages 15 to 49 - 826,700 people Obesity Rate - 20.1% |
I believe that Brazil is in the early stage of stage four of the demographic transition model. The graph itself in 2015 represents more of a stage three representation of the model, but the data argues differently. The crude birth rate is fairly high, but it in decline, and the crude death rate is already low. The natural rate of increase is fairly low and will probably continue to decrease. The life expectancy of individuals is 73.8 years which is in-between the stage four limits of 65 years to 75 years and the fertility rate is 1.76 children born per woman which is fairly small considering the country is in the beginning stages of stage four. It is close and debatable if Brazil is still in stage three, but there is evidence to prove that the country is already progressing in stage four.

|
